SignalCare

Analytics

Open navigation

Reporting Trust Audit

Move from a reported number to a result leaders can trust.

SignalCare traces the reported metric through its specification, source, logic, validation, and exceptions so the team can establish a trusted signal before leaders act.

See What We Review

No PHI is needed for the initial conversation.

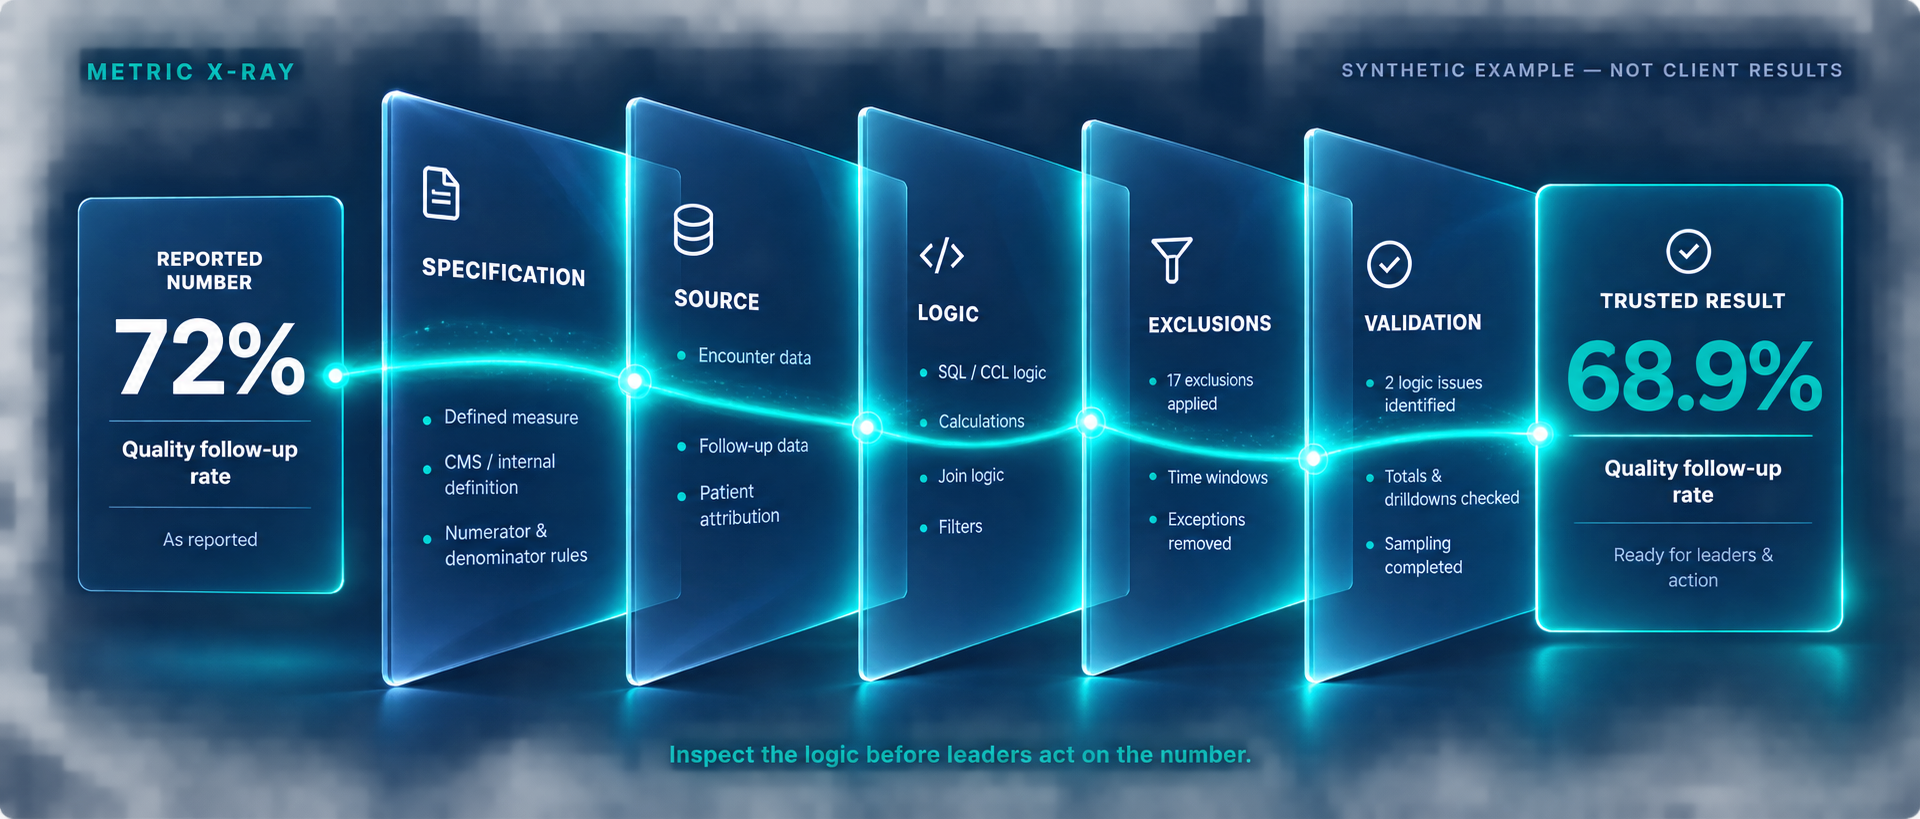
Metric X-Ray

Synthetic example — not client results

  1. Reported72%Quality follow-up rate · as reported
  2. SpecificationDefined measure · CMS / internal definition · Numerator & denominator rules
  3. SourceEncounter data · Follow-up data · Patient attribution
  4. LogicSQL / CCL logic · Calculations · Join logic · Filters
  5. Exclusions17 exclusions applied · Time windows · Exceptions removed
  6. Validation2 logic issues identified · Totals & drilldowns checked · Sampling completed
  7. Trusted result68.9%Quality follow-up rate · ready for leaders & action

What we review

The questions behind conflicting numbers.

SignalCare reviews the metric layer beneath dashboards so teams can agree on what is measured and why.

Metric Definitions

Clarity, intent, owner, and business rules.

SQL / CCL Logic

Validate queries, joins, filters, and calculations.

Numerators & Denominators

Confirm logic matches the business intent.

Exclusions & Edge Cases

Validate exclusions, edge cases, and data-quality filters.

Source-to-Dashboard Mapping

Trace data from source tables to visuals.

Refresh Timing

Confirm data latency and refresh schedules.

Provider / Location Attribution

Validate attribution logic and grouping rules.

Drilldown Validation

Ensure detail matches summary at every level.

The framework

A clear path from reported to trusted.

  1. 01

    Metric Selection

    Agree on the metric and reporting use case.

  2. 02

    Definition Review

    Review intent, definitions, business rules, and measurement logic.

  3. 03

    Source Mapping

    Map source systems, tables, populations, and timing.

  4. 04

    Logic Validation

    Validate SQL / CCL logic against the definition.

  5. 05

    Output Comparison

    Compare dashboards and exports to the validated result.

  6. 06

    Fix Recommendations

    Document issues, impact, and recommended corrections.

What you get

Clear findings.
Stronger decisions.

Executive Findings Summary

High-level view of risks and impacts.

Metric Definition Matrix

Complete definitions, rules, and ownership.

Source Map

End-to-end data lineage and logic flow.

Logic Risk Scorecard

Issues ranked by severity and impact.

Recommended Fixes

Clear actions with expected results.

Optional Dashboard Roadmap

Recommended next views and signals.

Ready to establish which numbers your leaders can trust?

  • Clear scope before we build
  • Works with your existing data & reports
  • No dashboard rebuild required
  • Executive-ready findings
See What We Review